Skip to main content Skip to footer

ESG Report 2025/26

About us


Karbon Homes builds, manages and looks after affordable homes for people across the North. The aim is to give all customers the stronger foundations they need to get on with life.

Since our formation in 2017, Karbon has focused on three strategic aims: providing good quality homes, delivering excellent experience to our customers, and shaping strong, sustainable places for our communities. 

We work across the North East of England and Yorkshire, with over 34,000 homes in communities facing different opportunities and challenges. 

Some customers just need an affordable home, or a way onto the property ladder. Others might need more – financial wellbeing support, community services, supported accommodation or training that can lead to a new job. Whatever people need to feel more secure, confident and settled, we work hard to provide it.

We believe that by focusing on our three strategic aims, combining a sound business head with a strong social heart and staying true to our values, we can build strong foundations for even more people.

Foreword


I am pleased to introduce this year’s Environmental, Social and Governance Report, which sets out our performance over the past year and the difference we are making as an organisation.

The context for housing providers continues to change, shaped by regulatory reform, rising costs and an increasing focus on customer outcomes. Our priority has been to respond to these changes in a clear and practical way, supporting a strong performance today while building resilience for the future.

Our environmental responsibility is one of the areas where these pressures are most clearly felt. Meeting new energy efficiency requirements, including emerging standards such as Mean Energy Efficiency Standards (MEES), brings both opportunity and significant cost. In this report, we set out what these requirements mean in practice - not only in terms of compliance, but also in the investment decisions we make, the balancing of priorities and the long-term impact on our homes and customers.

During the year, we continued to deliver at scale despite these pressures, completing 478 new homes and maintaining strong financial discipline across a £920m committed development programme, representing our multi-year pipeline of new homes, with £107.9m invested during the year.

As a locally rooted organisation, our strength has always been our understanding of the communities we serve. We are building on that foundation by combining local knowledge with better data and insight, allowing us to respond more consistently and proactively as we continue to grow. This year, we have made great progress with our ambitious Getting to Know you project, which aims to encourage customers to share their data with us to help improve our service to them, alongside the introduction of tools like 360View, which help us to use that data to improve customer experience in practical ways.

This report sets out how we are strengthening the link between customer insight, service delivery and investment, so that our decisions are better informed and deliver clear, lasting value for our customers and communities. We hope you enjoy it.

Paul Fiddaman, Group Chief Executive   

An image of Karbon Homes Chief Executive Paul Fiddaman.

Paul Fiddaman, Group Chief Executive

Our sustainability summary


Note to reader: The Karbon Group consists of Karbon Homes and its subsidiary 54North. The figures used in this report are for Karbon Homes apart from those marked *

Group 6

34,347

homes*

Content 23

100%

Decent Homes Standard

Key And Keyring

478

new homes completed in 2025/26*

Bfd623eb 0255 49A6 8C92 3Da1da221bf5

83.4%

of our homes achieve EPC C or above*

9Be5b2da 2898 4A5e Bac8 45D22c2e7a5c (1)

38.3%

Our rents as an average of a typical market rented property across our region*

36466946 1322 4903 Bae4 3A8ac7aec551

1,975

energy efficiency upgrades

172B5ccf 0887 4106 Ad1f 8710800973Ab

5,277

customers helped through our Money Matters Team, with £8.3m generated for them in additional income

D9a6652c 88B9 4Bc2 A5a7 96Ed4ec542fb

1,336

colleagues all paid at living wage or above*

92Ae7560 D450 48E2 B29c Caab6168ccf2

3.7%

mean gender pay gap*

5E8bf66a 6D3a 4Bd0 A5a0 D5926e2c7b9b

+42

Colleague Net Promoter Score in 25/26*

4F5b33d2 1F9f 4577 A48e C2de1924d76c (1)

G1/V1/C2

top governance and viability regulatory rating*

7C344a38 Cb80 48A1 Aa63 1314464073E5

A

(stable) S&P Global rating May 2026*

* Karbon Group figures

UN Sustainable Development Goals


Our work has a direct impact against the UN Sustainable Development Goals, as illustrated below, with ‘sustainable cities and communities’ at the heart. These SDGs helped to form the Sustainability Reporting Standard and will be highlighted throughout:
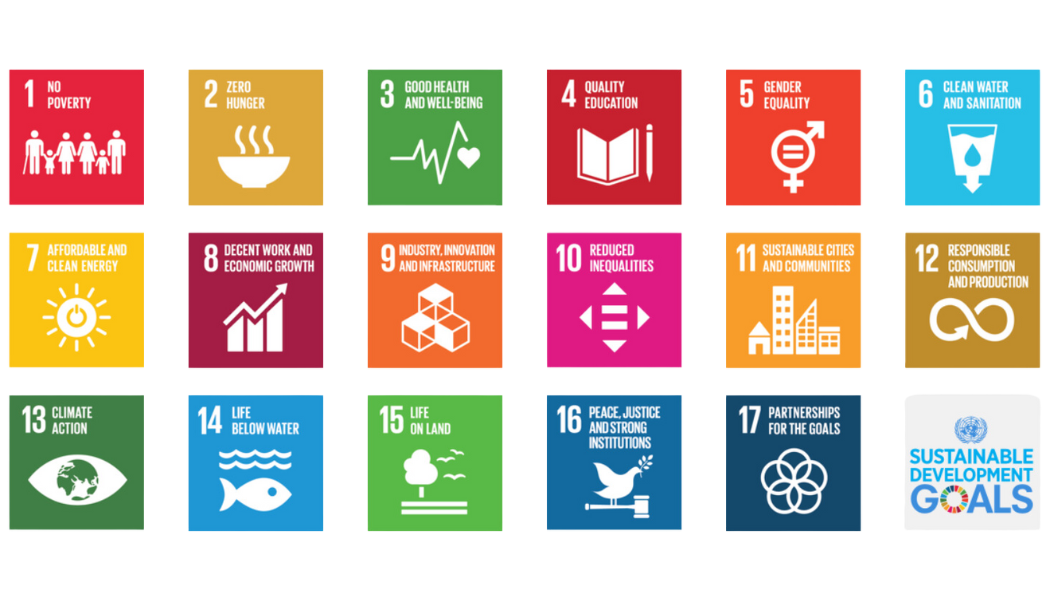
Picture of the 17 world Sustainable Development Goals (SDGs) created and adopted by United Nations Members. The SDGs are relevant to the Sustainability Reporting Standard which you read here because each of the reports twelve themes has been aligned with the UN Sustainable Development Goals (SDGs).


Environmental


In July 2026, we achieved a gold rating. We received a score of 62.43 - up 2.68 points on the previous year. We also ranked 7th out of the 40 most recent SHIFT assessments, giving a clear, quantified view of our performance against comparable housing associations.

Theme

2025-26 score

2024-25 score

Difference

Max possible score

Max and actual score difference

Existing homes

23.18

22.66

0.52

35.5

12.32

Resident engagement

2.68

3.06

-0.38

8

5.32

New build

7.93

7.74

0.19

15

7.07

Offices and operations

8.03

8.96

-0.93

15

6.97

Leadership and strategy

13.0

8.6

4.4

15

2.0

DLO and supply chain

7.61

8.73

-1.12

11.5

3.89

Overall score

62.43

59.75

2.68

100

37.57

SHIFT brings together environmental indicators across homes, operations and our supply chain into a single benchmark score. It uses both primary data and recognised sector methodologies, applying modelled assumptions where complete datasets are not yet available. This gives us more than a rating: it helps show where performance is strong, where data needs to improve and where delivery can be strengthened.

Our ESG reporting is also aligned to the Sustainability Reporting Standard (SRS), which sets out defined, auditable metrics across areas such as energy, waste and resource use. SHIFT and the SRS serve different purposes, but they increasingly point in the same direction. Our focus is on improving the quality, coverage and consistency of our data, reducing reliance on assumptions and making sure reporting reflects delivery on the ground.

Our direction of travel was tested through an ESG Reporting Review by RSM in February 2026. The review confirmed that we have a well-established foundation for delivering net zero, meeting all 46 Sustainability Reporting Standard criteria, with governance, reporting and measurable outcomes in place.

The review also recognised that our approach is not a series of isolated initiatives. It is supported by SHIFT benchmarking, our Environmental Strategic Plan and the Stronger Foundations programme, which bring together investment, performance and customer priorities. It also confirmed that ESG is embedded within risk management, business planning and board-level oversight.

This shows that we are moving beyond compliance, with a stronger focus on impact, transparency and consistent, measurable outcomes.
Climate change


UN sustainable development goals: 1 - No poverty, 7 - affordable and clean energy and 13 - climate action.

As at 31 March 2026, 76.05% of existing homes* are reported by SHIFT as rated EPC C or above. This figure is based on our measured Statistical Data Return (SDR) and covers only our low cost rental accommodation (LCRA) stock for which we hold responsibility for meeting the Decent Homes Standard.

We lifted 883 existing homes above the EPC C threshold this year with retrofit improvements, which shows the pace at which we are reaching EPC C as a minimum.

There was however a slight dip in the proportion of EPC C rated homes this year. The introduction of SAP10 methodology in June 2025 recategorised most of our Byker Estate homes from C to D. Byker is served by a district heating system and we are reviewing options to decarbonise and improve that system. We are currently renewing the district heating system serving this estate, which will decarbonise the 1,800-home network.

EPC rating

% homes 25/26

% homes 24/25

% homes 23/24

A

1.66%

0.96%

0.4%

B

17.23%

16.59%

15%

C

57.16%

60.64%

56%

D

22.59%

21.14%

24%

E or below

0.73%

0.67%

1%

*Karbon Association homes for which we have Decent Homes responsibility. No data: 0.63%.

Looking beyond this reported subset, our latest modelled data for all Karbon Group homes - including those for which we do not hold a Decent Homes duty - shows 83.41% rated EPC C or above. The two figures are complementary rather than conflicting: 76.05% is our measured, externally reported position for a specific subsection of our stock, while 83.41% reflects a modelled estimate across the full portfolio.

We plan to invest £15.2m in existing homes over the next four years, upgrading nearly 6,000 lower performing properties to EPC C and helping reduce energy costs for customers.

EPC rating

% of homes 25/26

% homes 24/25

% homes 23/24

A

40%

43.53%

18%

B

60%

56.47%

82%


If so, what is it and when does the housing provider intend to be Net Zero by? 

Our Environmental Strategic Plan (2025–30) sets out how we will manage climate-related risks and opportunities across our homes, services and operations, while working towards net zero emissions by 2050.

The strategy is divided into clear categories: existing homes, new homes, customers, colleagues, offices and operations, and innovation.

Our pathway to net zero has three phases:

  • 2030: Core housing and data foundations, including EPC C where feasible and prioritisation of lower-performing homes
  • 2035: Fleet will be fully decarbonised
  • 2050: Full net zero delivery through sustained retrofit and low-carbon technologies

SHIFT provides independent benchmarking across homes, operations and supply chain.

To ensure decarbonisation is grounded in financial reality and asset strategy, our goals are embedded in our 30-year Business Plan. This includes:

  • a programme to achieve EPC C by 2030 – estimated £15.2m investment (Karbon Association only)
  • investment for future Minimum Energy Efficiency Standards (MEES) by 2039 - £137.5m
  • stress testing the cost of net zero by 2050 - £520.8m.

This modelling makes the scale of investment clear and shows where external funding will be needed, with significant net costs identified across EPC, MEES and full net zero delivery.

Assumptions are updated annually to reflect delivery, cost forecasts and changes in policy or funding, so plans remain current and realistic rather than fixed.

Delivery is supported by a data-led asset management approach. With an 85% stock condition survey rate, we use tools such as Portfolio and SHAPE to combine property condition, EPC and investment data. This helps us test options, prioritise investment and target the homes where intervention will have the greatest impact.

What retrofit activities has the housing provider undertaken in the last 12 months in relation to its housing stock?

In 2025/26, we delivered measurable progress against our net zero strategy, focused on improving the energy performance of existing homes and preparing for long-term delivery.

We completed 1,975 energy efficiency upgrades across our housing stock and replaced or upgraded 1,456 heating systems.

Investment is shaped by the funding available to the sector. We secured £1.8m from DESNZ through the Warm Homes: Social Housing Fund for delivery through to 2028, initially targeting around 100 homes in Stanley, including solar PV across 39 properties. We have recently successfully won a bid for a further £ 3,09m (£3,085,826) funding, which will support similar measures for around 478 additional homes in the coming year.

Our stock condition survey programme has reached an 85% access rate, giving us robust and accurate data to assess the environmental performance of our homes.

As well as protecting us from adverse Consumer Regulation judgements – many lower ratings correlate with low stock condition surveys - our superior stock condition data supports a shift from modelled assumptions to investment decisions based on real-world conditions, improving the accuracy of our retrofit programme and our long-term financial forecasting.

The scale of the challenge is significant. Our current gross development cost per home is £204,000, while the investment required to deliver net zero is estimated at around £37,590 per property over the next 30 years. Comparing these costs shows the scale of net zero investment alongside our future development ambitions.

Net zero interventions in people’s homes cannot be treated as purely technical measures. They require us to be able to access our homes, understand our customers’ needs and concerns, and actively support them. The latest independent SHIFT assessment shows that 100% of residents have access to energy efficiency information via our website as well as opportunities to get involved in a number of ongoing active engagement activities, reflecting the breadth of advice, guidance and ongoing interaction across our homes. This is fundamental to successful outcomes: without it, programmes risk refusal, lack of access and reduced impact.

Maintaining this level of engagement helps make the transition deliverable, ensuring large-scale investment translates into practical progress towards net zero.

Total emissions per home

If unable to report emissions data, please state when the housing provider is expected to be able to do so.

Scope

Primary source of emissions

Current analysis

2025/26

CO2 tonnes (tCO2e)

2024/25

CO2 tonnes (tCO2e)

Reduction

1

Maintenance activities/fleet


Direct emissions from the combustion of fuels (gas, diesel, and petrol) directly purchased by Karbon

3,918.40

3,983.96

65.56

2

Karbon offices

Includes the electricity and heat we purchase for our offices

508.76

594.39

85.63

3

Housing stock


Indirect emissions predominantly from our housing stock, estimated using SAP and heating system data

63,743.45


78,957.06

15,213.61

Total

68,170.61

83,535.41

15,364.80

68,170.61 tCO2e equates to 2.39 tCO2e per home managed.

The significant reduction in Scope 3 emissions reflects both improvements in stock performance and a step change in data quality. In 2024/25, housing stock emissions were derived using SHIFT estimates where asset-level emissions data was unavailable. In 2025/26, emissions were calculated using data from our own asset management systems, providing a more accurate picture of housing stock emissions. This demonstrates the increasing maturity of our asset data and confirms that actual emissions from our homes are lower than previous modelled estimates.

How is the housing provider mitigating these risks?

Our Environmental Strategic Plan sets out that new homes should be built in areas with low flood and overheating risk, or include appropriate mitigation where this is not possible.

Flood risk is assessed at property level using Environment Agency data within our Portfolio asset system. This helps us to:

  • identify higher risk homes
  • inform option appraisal and investment planning through SHAPE, alongside financial and social performance
  • prioritise intervention through planned investment programmes.

The SHIFT assessment indicates that 97.40% of homes are at low flood risk, providing a clear benchmarked baseline across our stock.

How is the housing provider mitigating these risks?

We are developing a water management action plan for our offices. For our homes, water efficiency is assessed through SHIFT modelling and asset data. SHIFT estimates current performance at 129.49 litres per person per day, indicating a relatively efficient baseline across our homes.

We ensure mitigation of risks through specification and investment decisions, with water efficiency built into:

  • retrofit and planned works, informed by asset data
  • new build and improvement standards, including efficient fittings
  • longer-term asset planning and portfolio modelling.

How is the housing provider mitigating these risks?

We assess overheating risk using asset data and climate modelling. SHIFT indicates that 97.96% of homes are at low overheating risk, with no homes currently identified as high risk, placing our stock in a strong position against sector benchmarks. To date this hasn’t been a priority due to the low numbers but we are looking at this over the next few years.

The assessment combines SAP data, property characteristics and climate modelling using tools such as Cotality, a property data and analytics platform used to support asset planning and investment decisions. This provides a consistent, property-level view of overheating risk across our homes and helps us monitor how risk may change over time. 

We mitigate overheating risk through investment planning and asset management. Overheating considerations are built into major investment, retrofit and development decisions, helping ensure that factors such as insulation, ventilation and overall building performance are considered together. We also review customer feedback, complaints and data on customer vulnerabilities. This supports a balanced approach to improving energy efficiency while maintaining comfortable and resilient homes. 

The insights generated through this analysis are integrated into our wider asset management approach, helping us identify emerging risks, target further investigation where needed and ensure climate resilience is reflected in long-term investment and portfolio planning.

Nature


UN sustainable development goals: 11 - sustainable cities and communities and 15 - life on land

If yes, please describe with reference to targets in this area.

If no, is the housing provider planning on producing one in the next 12 months?

Our approach is set out in our Environmental Strategic Plan and supported by GIS mapping, SHIFT reporting and biodiversity net gain (BNG) requirements.

We start with a clear understanding of the land we manage. We map all our green spaces using GIS and categorise them by habitat type, including grassland, woodland and shrubland. SHIFT then converts those land types into biomass density, measured as tonnes of habitat biomass per hectare. This provides a consistent measure of ecological quality across our stock. We currently have:

  • 4.90 tonnes of biomass per hectare, equivalent to approximately 3,730 tonnes of above-ground biomass across our land.

We have begun to measure habitat units per hectare of land owned which is currently 0.53, equating to 409.75 total habitat units across Karbon stock. SHIFT indicates that there should be 1.02 habitat units per hectare of landlord land by 2043. This gives us a clear starting point. We will seek to improve this by enhancing the quality and density of existing habitats, alongside biodiversity gains through development and land-led activity. 8.2% of homes built in the reporting period received ecological enhancements to meet BNG requirements. We have set long-term targets to increase biodiversity value to:

  • 5.00 tonnes per hectare by 2030
  • 6.87 tonnes per hectare by 2035
  • 11.90 tonnes per hectare by 2043.

On existing green spaces, we promote biodiversity through:

  • reduced mowing regimes allowing wildflowers and grasses to establish within amenity grassland, targeted planting which improves species diversity, and ongoing maintenance to support habitat maturity and resilience
  • data-led management of trees and green assets: GIS mapping is supported by Ezytreev tree management software, helping us assess the condition of trees, increase canopy cover and target interventions where ecological value is lowest.

At our new 54North Homes development, Pilkington Grove in Leeds, we’ve brought biodiversity to life through a simple but impactful community-led initiative involving local young people.

Scouts from the 17th South West Leeds group and students from Leeds College of Building designed and built a series of hedgehog houses and insect habitats, using donated materials and guided by skilled tradespeople to ensure they met recognised ecological standards.

These habitats have now been installed across the development, within landscaped areas that include green space and mature trees. Together, they provide safe shelter and feeding opportunities for wildlife, supporting pollinators and small mammals while helping to establish a more balanced local ecosystem as the site develops.

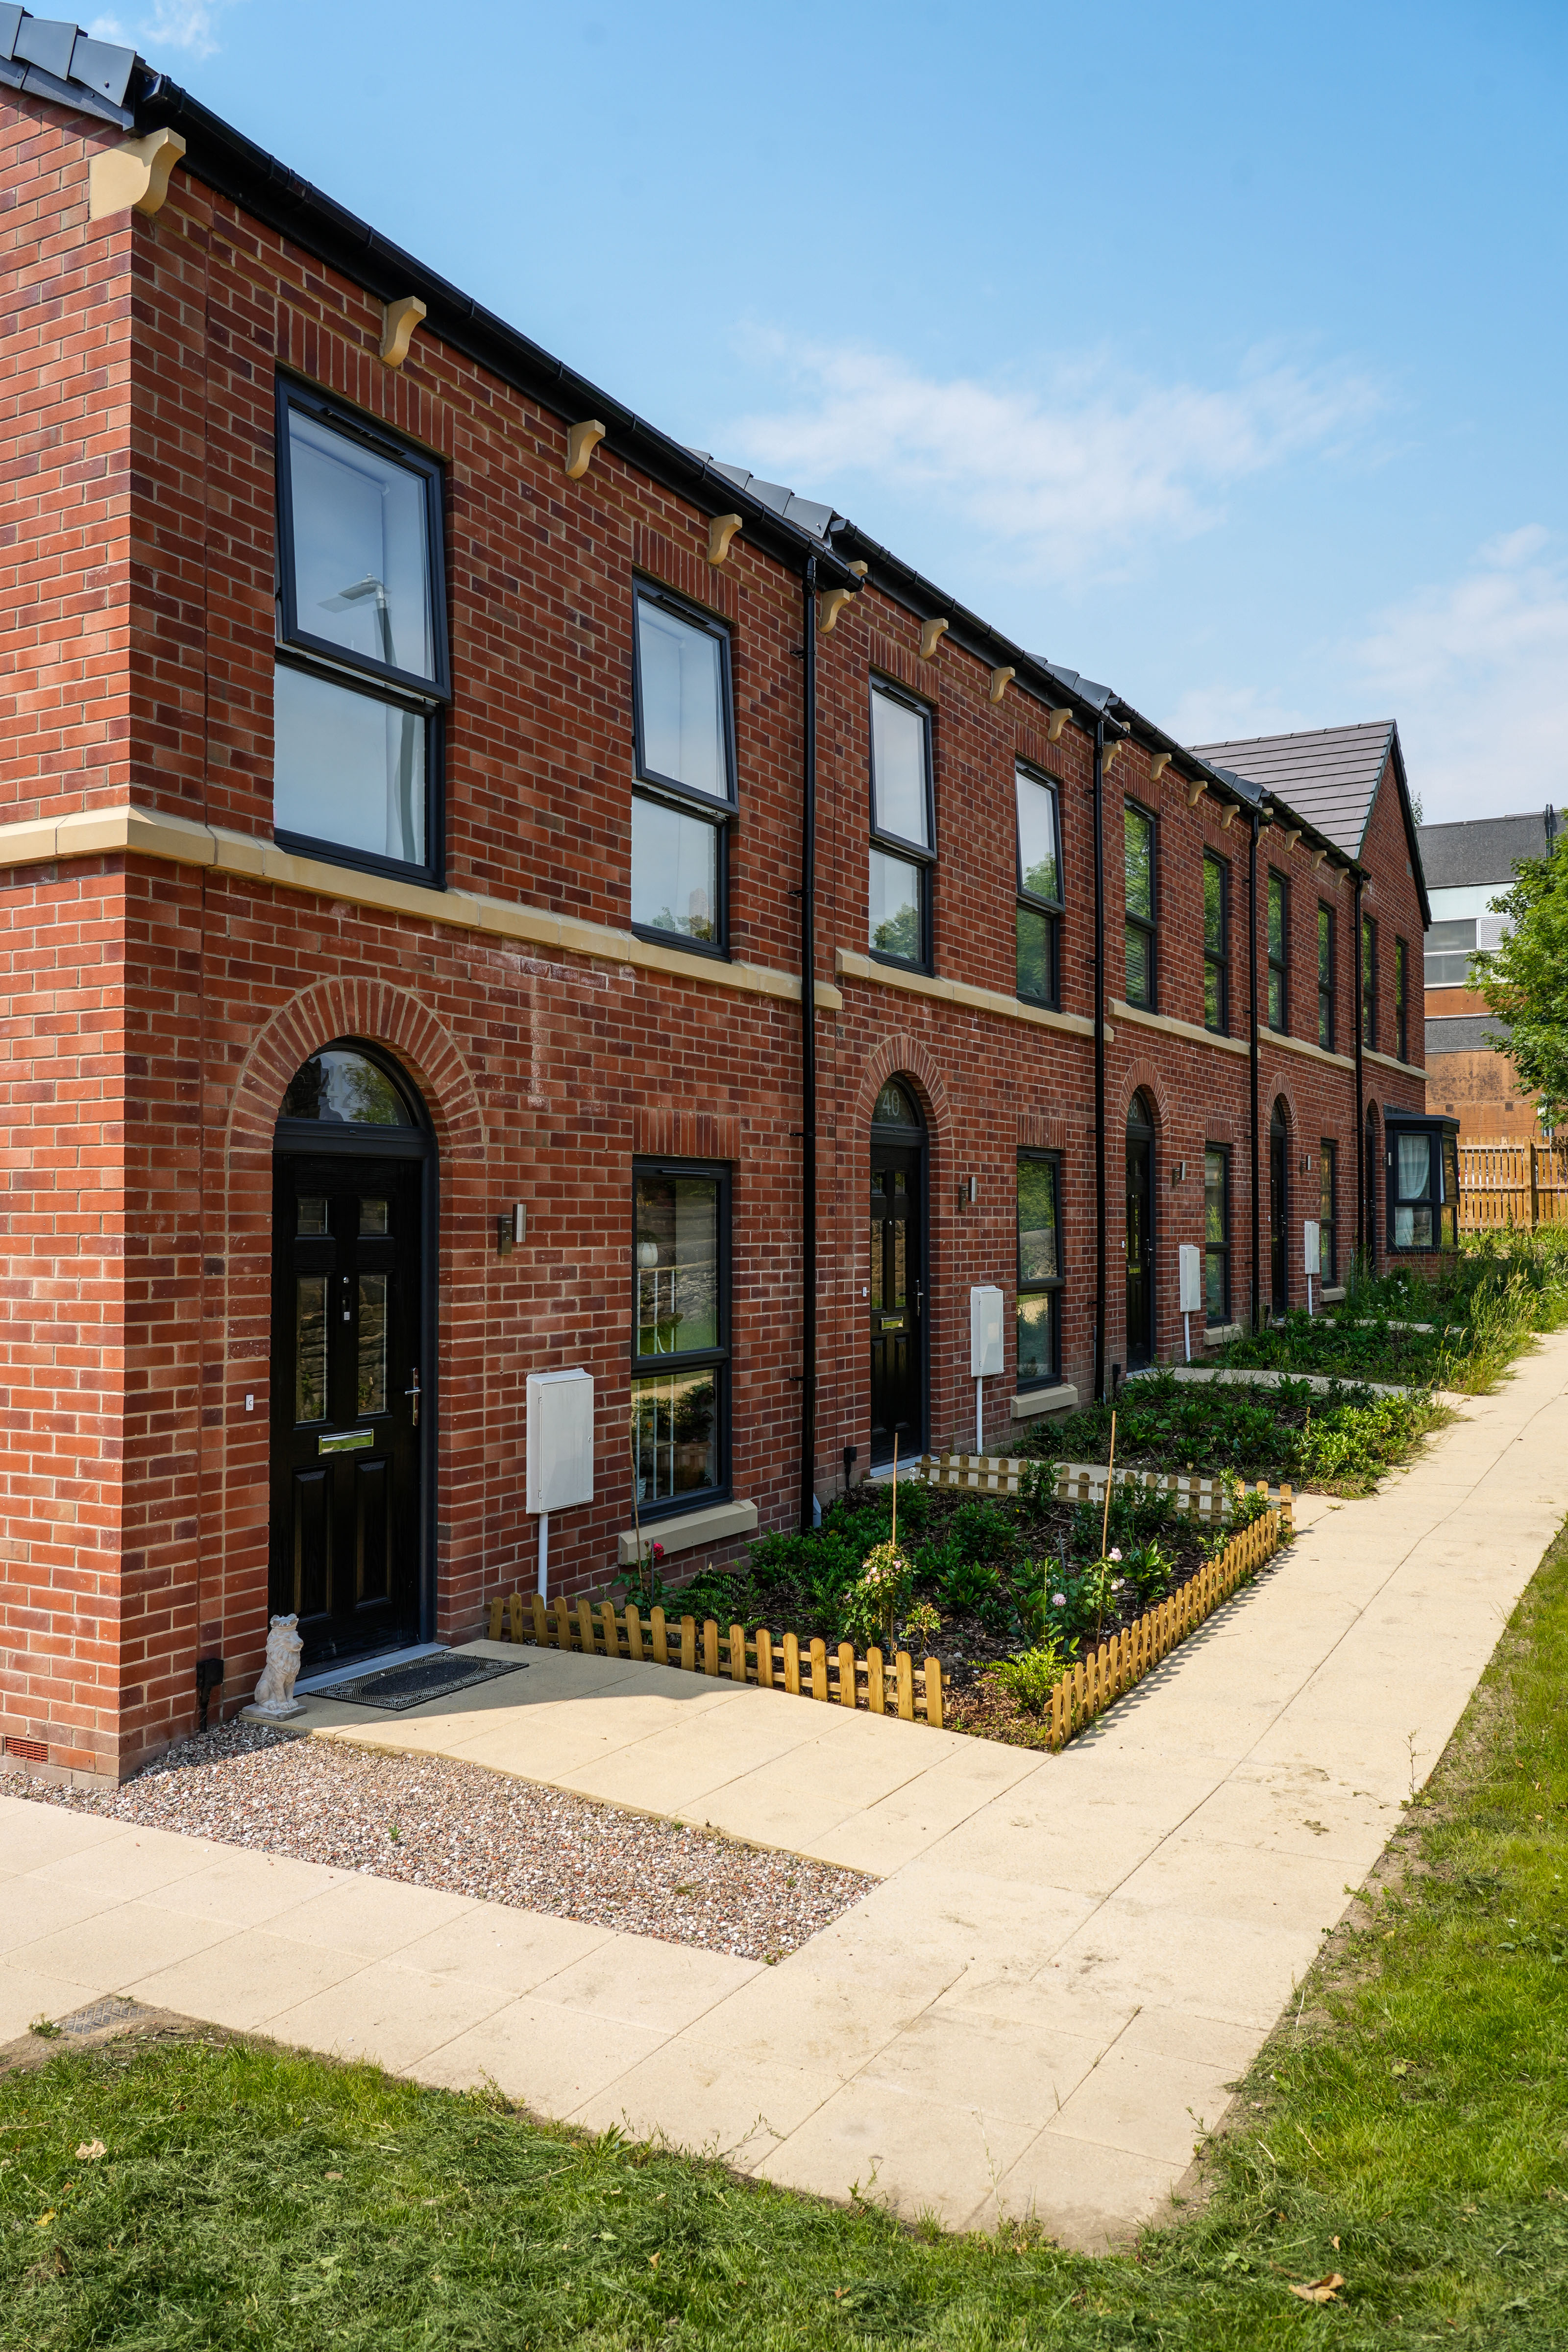
The wider scheme delivers 28 energy-efficient homes, combining high-quality, affordable housing with environmental considerations that extend beyond the homes themselves.

What makes this project stand out is its simplicity and impact. By involving local young people, it has created more than just habitats for wildlife - it has built awareness, developed skills and strengthened connections between the development and the surrounding community. The result is a place where biodiversity is not an afterthought, but something shaped and supported by the people who live nearby.

This approach reflects how smaller, community-driven interventions can play a valuable role in delivering wider environmental outcomes. We are now exploring opportunities to develop similar initiatives in other schemes, including at the Byker Estate and Seaham Garden Village, with each location offering its own unique natural environment.

Through our evolving social value approach, we are also working with partners and contractors to unlock more opportunities for projects like this - embedding biodiversity and community involvement into the way we design and deliver our developments.

In doing so, we are delivering against our ambition to create places where people and nature can thrive together.
If so, how does the housing provider target and measure performance? 

We identify and manage pollutant risks through established health and safety systems, primarily COSHH assessments and task-based risk assessments.

COSHH assessments identify hazardous substances used in our operations and the potential risks they pose to people and the environment. They define control measures, safe handling arrangements, emergency actions and protections to prevent contamination of land and drainage systems.

Task-based risk assessments consider how different activities may introduce pollutant risks and ensure we put appropriate controls in place to minimise harm.

These controls are supported by safe storage, handling and disposal processes, contractor requirements and staff training. We monitor performance through COSHH compliance, internal audits and incident reporting, and manage any environmental incidents through established procedures.
Resource management


UN sustainable development goals: 11 - sustainable cities and communities and 12 - responsible consumption and production.

If so, how does the housing provider target and measure performance?

SHIFT estimates that 57% of materials used in repairs and maintenance are responsibly sourced, based on supplier certifications and available data. This provides an independently assessed baseline of our current position within our Property Services.

Through our Environmental Strategic Plan, we are now extending this approach across repairs, development and our wider supply chain, establishing a minimum 60% baseline across all activities by 2030. This reflects a shift from a single service measure to a consistent, organisation-wide KPI, improving comparability and control.

SHIFT also highlights that, in some areas, supplier data is incomplete and, therefore, industry-standard assumptions are applied. A key next step for us is to strengthen the quality and coverage of this data, aligned with our ESG approach to developing more robust, auditable supply chain metrics.

If so, how does the housing provider target and measure performance?

In 2025–26, 84.28% of waste was diverted from landfill. This reflects a significantly wider reporting scope than in previous years, now capturing waste from repairs, planned investment, refurbishment, development and wider contractor activity, providing a more representative baseline.

This builds on our established operational practices, including segregation into ten waste streams, supporting high levels of recycling and reuse.

Through our Environmental Strategic Plan, we are moving towards a target-led model, including 97% diversion of refurbishment waste by 2030, aligned to circular economy principles.

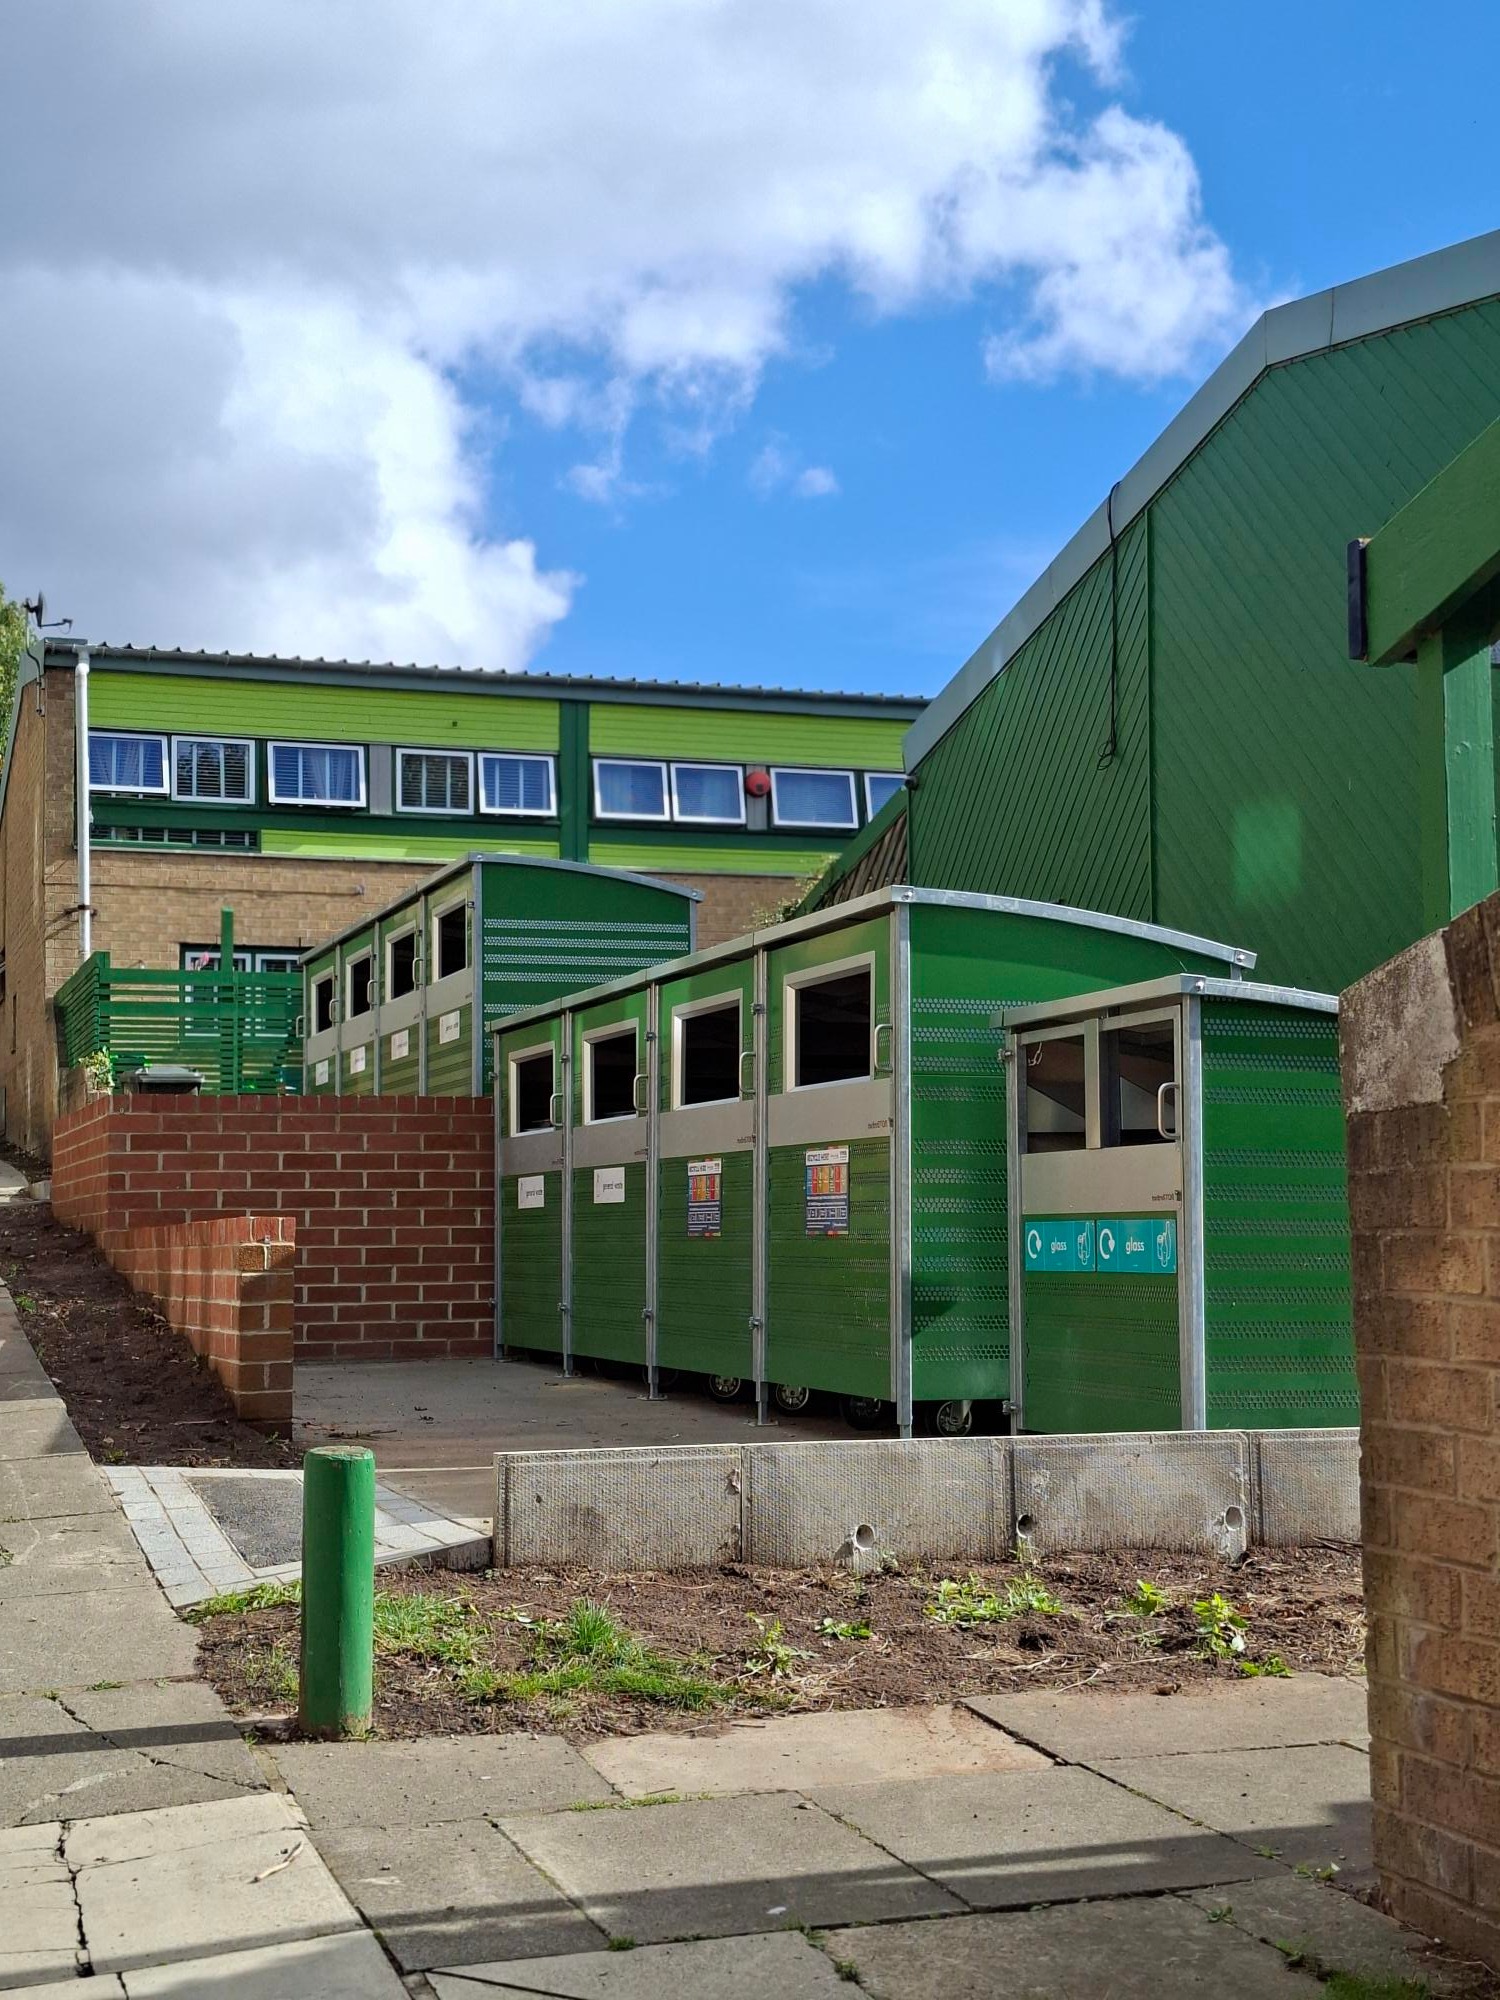
This approach is also reflected at estate level through initiatives such as improved waste and recycling provision in Byker (see case study below).

On the Byker Estate, waste management had become one of the issues residents cared about most. Litter, fly tipping and poor recycling were affecting how the estate looked and felt, and residents told us they wanted to see change.

Following consultation with customers in 2021, when Byker Community Trust became part of Karbon Homes, we worked with residents, colleagues and partners to develop a practical response. The result was a trial programme in Headlam Green and Dunn Terrace, bringing together new communal bin stores with clear, consistent engagement around recycling and responsible waste disposal.

This was not a straightforward project. The Byker Estate is Grade II* listed, so any changes to the physical environment need to be carefully managed. That made communication even more important. We needed residents to understand what was changing, why it mattered and how they could play their part.

To support the trial, we provided regular updates to customers, easy-to-use FAQs, local maps showing each block’s nearest bin store, recycling bags with clear guidance, and community activity delivered with the local authority. This helped make the changes visible, practical and easy for residents to understand and use.

The impact was clear. Before the trial, recycling collections were close to zero because contamination levels were so high. In the first six weeks, more than 30,000 litres of uncontaminated recycling were collected from the two neighbourhoods - equivalent to around 125 standard 240-litre wheelie bins.

That figure has now grown to more than 300,000 litres of uncontaminated recycling, equivalent to around 1,250 standard wheelie bins. Residents have also told us the areas feel cleaner and that recycling has become easier to do well.

The success of the project has been recognised externally, with the campaign shortlisted for the CIPR Excellence Awards in the Change Communications Campaign category. For us, the recognition reflects the strength of combining practical improvements with the right conversations, at the right time, with the people most affected.

Michelle Bell, Assistant Director of Byker Community Trust, said: “It is brilliant to see the hard work and dedication of those involved in the project being highlighted. We’re very grateful to our community for their dedication to helping us transform the Dunn Terrace and Headlam Green areas of the estate, and hope that this recognition will help us to create further improvement across the estate.”

The project shows how estate-level environmental improvement can support stronger communities when it is shaped around resident experience, clear communication and practical changes that make everyday life easier.
If so, how does the housing provider target and measure performance? 

We set targets for water usage both in our offices and our homes. SHIFT’s water efficiency calculator analyses the water efficiency measures we have installed in our homes to estimate water consumption across our stock as 129.49 litres per person per day. Our target is 125 litres per person by 2030. Water usage in our main offices was estimated to be 1.490 m3 total usage, which is 3.77m3 per employee. Our target is 3m3 per employee by 2030.

What measures are in place to monitor the sustainability of the housing provider’s supply chain when procuring goods and services?

We have embedded sustainability within procurement through a coordinated approach that brings together responsible sourcing, waste management and supply chain engagement.

Through our Environmental Strategic Plan, these areas are now aligned within a single framework of targets, KPIs and governance, ensuring consistency across repairs, development and our supply chain activity. This includes:

  • supplier requirements (e.g. FSC/PEFC, ISO14001, BES6001)
  • increasing use of responsibly sourced materials (see C11)
  • waste reduction and recycling expectations (see C12–C13)
  • embedding whole-life and circular economy considerations in decision-making.

SHIFT highlights that, across the sector, supply chain reporting can rely on assumptions where data is limited. Our focus is therefore on strengthening supplier engagement, data capture and KPI alignment, ensuring sustainability is not only specified in procurement, but consistently measured and delivered across the full lifecycle of works.


Social


This section explains how we deliver our core landlord services, how we hold ourselves to account for performance, and how we have a wider social impact across the communities we serve.

We are continuing to build a more complete and consistent understanding of our customers. Historically, customer insight in housing has often been fragmented, limiting our ability to respond proactively or identify emerging issues. At Karbon, we are addressing this through a connected approach to data, insight and service delivery.

Our Getting to Know You (GTKY) project has significantly improved the breadth and quality of our customer insight, enabling a structured understanding of household circumstances at scale. This is supported by our 360 View capability, which brings together information from across systems into a single, live view, allowing colleagues to understand the full context of a customer’s situation at the point of service and deliver more targeted support.

Alongside this, our Something’s Not Right (SNR) process embeds early identification of risk within everyday service delivery. Customer-facing colleagues can flag concerns during routine interactions, ensuring that we identify issues such as vulnerability, financial hardship or property condition earlier and can act upon them even when they have not been formally reported.

Our priority is to deliver safe, reliable core services. During the year, we completed almost 123,000 repairs, reflecting continued high levels of demand. This included around 85,000 non-emergency repairs and 38,000 emergency repairs, illustrating both the scale of routine maintenance and the need to maintain our rapid response capability.

Overall, we progressed around nine in ten repair requests without cancellation or reclassification, with 81% of non-emergency repairs and over 99% of emergency repairs completed within target timescales. This reflects increasing efficiency and consistency in how we diagnose, prioritise and deliver services.

Affordability


UN sustainable development goals: 1 - no poverty and 11 - sustainable cities and communities

- Rent compared to average private rental sector (PRS) rent across the relevant Local Authority

- Rent compared to the relevant Local Housing Allowance (LHA)

Local authority Average weekly rent Average LHA for local authority Karbon discount to LHA Median PRS for local authority Karbon discount to PRS
Barnsley £95.22 £103.56 8.1% £139.85 31.9%
County Durham £93.77 £98.50 4.8% £136.28 31.2%
Darlington £110.30 £112.15 1.6% £155.36 29.0%
East Riding of Yorkshire £105.85 £109.32 3.2% £146.77 27.9%
Gateshead £102.26 £127.86 20.0% £158.82 35.6%
Hartlepool £108.58 £112.39 3.4% £122.54 11.4%
Kirklees £100.12 £129.04 22.4% £169.22 40.8%
Leeds £104.44 £173.94 40.0% £222.66 53.1%
Middlesbrough £117.40 £116.27 (1.0%) £157.84 25.6%
Newcastle upon Tyne £98.12 £129.97 24.5% £231.86 57.7%
North Tyneside £105.35 £125.44 16.0% £159.91 34.1%
North Yorkshire £99.53 £104.68 4.9% £144.27 31.0%
Northumberland £97.28 £117.72 17.4% £139.33 30.2%
Redcar and Cleveland Borough £104.16 £112.77 7.6% £141.21 26.2%
South Tyneside £104.64 £132.18 20.8% £147.67 29.1%
Stockton on Tees £121.86 £127.85 4.7% £186.32 34.6%
Sunderland £98.58 £102.97 4.3% £129.61 23.9%
Wakefield £120.32 £146.71 18.0% £167.43 28.1%
York £123.85 £180.38 31.3% £250.62 50.6%
Total £98.19 £116.63 15.8% £159.07 38.3%

  • General needs (social rent)
  • Intermediate rent
  • Affordable rent
  • Supported housing (excluding housing for older people)
  • Housing for older people
  • Low-cost home ownership
  • Care homes
  • Private rented sector
  • Private market sale
  • Other

Tenures

Owned and managed by Karbon

Owned by Karbon but managed by 54North

Owned by Karbon but managed by others

Managed by Karbon for others

Owned and managed by 54North

Owned by 54 North but managed by others

Managed by 54North for others

Owned by Leazes but managed by Karbon

Total

Affordable - general needs

2,786

571

-

1

465

-

-

223

4,046

Affordable - older people

301

-

-

-

-

-

-

194

495

Affordable - supported

73

-

11

-

1

-

-

59

144

Care home

-

-

14

-

-

-

-

-

14

Social - general needs

21,579

220

2

1

1,617

4

-

192

23,615

Intermediate rent

961

312

-

-

90

-

-

11

1,374

LCHO

697

286

-

-

155

-

-

6

1,144

Non-social leasehold

7

-

35

-

-

-

-

-

42

Non-social rental housing

433

-

4

-

40

-

-

-

477

Social - older people

867

-

-

-

209

-

68

24

1,168

Social leasehold

596

1

-

-

10

-

-

3

610

Social - supported

331

-

113

-

164

-

-

32

640

Grand Total

28,631

1,390

179

2

2,751

4

68

744

33,769

  • General needs (social rent)
  • Intermediate rent
  • Affordable rent
  • Supported housing (excluding housing for older people)
  • Housing for older people
  • Low-cost home ownership
  • Care homes
  • Private rented sector
  • Private market sale
  • Other

Tenures

Total

Affordable - general needs

107

Affordable - supported

33

Social - general needs

100

Social - supported

4

Intermediate rent

152

LCHO

82

Grand total

478

GRAPHIC: Units completed by local authority 2025/26

During the year, we completed 478 new homes across our areas of operation, with 59% delivered in Yorkshire and 41% in the North East. The average development cost of our new homes is £204k per home, reflecting ongoing market pressures and higher investment standards. In total, we invested £107.9m in the delivery of new homes during the year, supported by £25.5m of Homes England grant funding.

We are addressing the impact of high energy costs by improving the energy efficiency of our homes and providing targeted financial support to customers. 83.4% of Karbon Group homes now achieve EPC C or above, while we build new homes to higher standards, with an average SAP rating of 90 and 81% achieving EPC A or a high B, helping to reduce energy use and ongoing heating costs.

Where additional support is needed, our financial wellbeing service provides practical assistance to customers. During the year, we distributed £31,286 in energy crisis vouchers to help households manage immediate cost pressures.

Building safety and quality


UN sustainable development goals: 11 - sustainable cities and communities

% of homes for which all required gas safety checks have been carried out.

% of homes that meet national fire safety regulations (varies by nation – see guidance).

% of homes for which all required electrical safety checks have been carried out.

% of homes for which all required asbestos management surveys or re-inspections have been carried out.

% of homes for which all required legionella risk assessments have been carried out.

% of homes for which all required communal passenger lift safety checks have been carried out.


Risk factor

% completed

% of homes for which all required gas safety checks have been

carried out. TMS BS01


100

% of homes for which all required fire risk assessments have been carried out. TSM BS02


100

% of homes for which all required electrical safety checks have been carried out within the last 5 years (all have been carried out within the last 10 years)


99.4

% of homes for which all required asbestos management surveys have been carried out. TSM BS03


100

% of homes for which all required legionella risk assessments have been carried out. TSM BS04


100

% of homes for which all required communal passenger lift safety checks have been carried out. TSM BS05

100

TSM Management Information Measures reported to the Regulator of Social Housing.

Our Building and Customer Safety Programme is strengthening our safety management system, including the production of safety cases for higher risk buildings. This includes three buildings registered with the Building Safety Regulator spanning across 18 high-rise blocks at Byker, where we will be delivering a £13.7m programme of fire safety improvements.

Resident assurance remains central to our approach. We provide clear routes for reporting concerns and engage residents through panels, surveys and direct feedback. We monitor performance through measures such as residents' understanding of fire safety procedures, perceptions of safety and confidence that concerns will be resolved effectively.

Of those which fail, what is the housing provider doing to address these failings?

100% of our homes met the Decent Homes Standard as at 31 March 2026, with no homes reported as failing the standard at year end. The standard requires homes to be free of Category 1 hazards, in a reasonable state of repair, have reasonably modern facilities and services, and provide a reasonable degree of thermal comfort.

Our assurance is based on physical inspection supported by modelling. We hold current stock condition survey data for 85% of homes, having sought access to 100%. We undertake surveys on a rolling five-year cycle through a mix of in-house and external surveyors, supported by independent quality checks. Where access is not possible, condition is modelled using comparable stock to ensure every property is reflected in investment planning.

The Regulator of Social Housing's 2024/25 stock profile shows that only 57.4% of large providers had physically inspected between 81% and 100% of their low-cost rental homes over five years, placing our coverage among the stronger performers in the sector.  We maintain 100% of homes meeting the DHS through a combination of responsive repairs and planned investment. Any Category 1 HHSRS hazard is addressed immediately through responsive repairs, contributing to 99.4% of emergency repairs being completed on time during the year, compared with a sector median of 96%.

Condition-related issues are managed through planned preventative maintenance, with investment prioritised according to age, condition and repair history, and delivered through our three-, five- and 30-year planned investment programmes. This is supported by regular asset management reporting and annual investment of around £15.5m in property compliance.

Looking ahead, we are aligning our investment and retrofit programmes to the Government's proposed reforms to the Decent Homes Standard, including new requirements relating to damp and mould and future Minimum Energy Efficiency Standards.

How do you reduce the likelihood of damp and mould hazards occurring?

Damp and mould is a health and safety issue. Our approach is designed to find problems early, respond quickly and reduce the chance of them happening again. Over the last two years, we have strengthened our approach to damp and mould, moving from a mainly reactive service to a clearer, risk-led system.

GRAPHIC: What have we done to improve our approach to damp and mould?

Prevention starts with knowing our homes well. Our stock condition survey programme, now covering 85% of our homes, helps us spot risks earlier and target work where it is most needed. Damp and mould is reported or identified through a range of routes, including customer contact, colleague visits, stock condition surveys and void inspections. This helps make sure issues are not missed.

We do not rely only on customers telling us there is a problem. Through our Something’s Not Right process, customer-facing colleagues can flag concerns during everyday visits and conversations, including where a customer may not have reported the issue themselves.

Once a case is identified, it follows a clear process:

  • logged with photographic evidence and Housing Health and Safety Rating System (HHSRS) categorisation
  • triaged based on severity and vulnerability
  • allocated to appropriate teams with defined response times
  • tracked through to completion with follow-up after three months.

Our triage approach means that we escalate the most serious cases immediately, while lower-risk cases are prioritised based on severity and customer vulnerability.

This is supported by systems developed through our working group on damp and mould, giving colleagues real-time oversight of cases and helping us meet Awaab’s Law requirements.


Reducing the likelihood of it occurring in the first place

GRAPHIC: What have we done to improve our approach to damp and mould?

We have also developed a predictive damp and mould risk model. It uses historic cases, property information, environmental factors and customer data to help identify homes most likely to experience issues before they arise. The model:

  • draws on circa 7,000 historic cases alongside non-case data
  • incorporates property, environmental and household characteristics
  • generates a risk probability for every home, grouped into five risk bands.

We will use this insight to:

  • prioritise inspection in high-risk homes
  • align investment to risk, not programme cycles
  • target effort where it will have the greatest impact.

Residents and community


UN sustainable development goals: 3 - good health and well-being and 11 sustainable cities and communities

How has the housing provider acted on these results?

TSM

2024/25 Group weighted results

2025/26 Group weighted results

% Difference

Change

Benchmarking

TP01 Overall satisfaction

81.5%

84.9%

3.4%

Upper quartile

TP02 Repairs service

84.1%

83.8%

-0.3%

Upper quartile

TP03 Time taken repairs

74.6%

74.9%

0.3%

Median/upper quartile

TP04 Home maintained

84.8%

85.2%

0.4%

Upper quartile

TP05 Safe home

89.9%

90.5%

0.6%

Upper quartile

TP06 Listens and acts

70.9%

77.2%

6.3%

Upper quartile

TP07 Kept informed

85.6%

85.5%

-0.1%

Upper quartile

TP08 Treated fairly and with respect

89.8%

89.6%

-0.2%

Upper quartile

TP09 Complaints handling

43.2%

54.6%

11.4%

Upper quartile

TP10 Communal areas

74.7%

83.2%

8.5%

Upper quartile

TP11 Neighbourhood satisfaction

76.3%

80.8%

4.5%

Upper quartile

TP12 ASB

68.3%

72.6%

4.3%

Upper quartile

Results of Low Cost Rental Accommodation Tenant Satisfaction Measure Survey reported to the Regulator of Social Housing.

Despite largely upper quartile results, we identified lower performance in our complaints indicator so we created a dedicated complaints team in May 2025. As a result, we have seen a clear improvement this year with satisfaction increasing from 43.2% to 54.6%. The team works with operational colleagues to record, oversee and follow up complaint actions, including a new role focused on learning from complaints. Timeliness has improved significantly, and the team is now helping us respond more consistently, triage complaints earlier and learn more from the issues customers raise.

There are two main routes for customers to hold us to account – through our Resident Engagement Framework which we address further in C31, and through our Complaints process.

Our Complaints, Compliments and Suggestions Policy defines a complaint as ‘any expression of dissatisfaction, however made’. Customers do not need to use the word ‘complaint’ for us to recognise and act on their concern.

An issue may start as a service request. If the customer is unhappy with the outcome or the way it has been handled, they can raise a formal complaint, ensuring the issue is recorded, reviewed and followed through.

Once a complaint is raised, it is allocated to named colleagues and investigated through clear stages, with senior involvement increasing where a complaint is escalated.

  • At Stage 1, complaints are investigated by a named complaint handler in partnership with a named operational lead at Team Leader, Manager or Head of Service level.
  • At Stage 2, complaints are reviewed by a more senior complaint handler with a named operational lead at a more senior level.

If customers remain dissatisfied, they can request escalation to Stage 2. After that, they have the right to refer their complaint to the Housing Ombudsman for independent review.

All complaints are formally recorded, including the original issue, investigation, decisions and actions. This creates a clear audit trail and makes sure concerns are visible, owned and followed through.

Complaints performance and learning are reported to the Karbon Residents Committee, the Group Customer Committee and the Group Board, giving residents and board members a clear view of how we are performing and where we need to improve. We also publish an annual complaints report and self-assessment for customers and provide them with our learnings from complaints.

Overall, customer concerns are:

  • recognised as a complaint where appropriate
  • owned by named individuals
  • escalated through management where required
  • subject to resident scrutiny and board oversight.

One named board member and one executive director are responsible for complaints and oversee our complaints performance. This makes sure management stays connected to customer challenge and is accountable for putting things right.

Report ONE OR BOTH of the following quantitative metrics:

- % of Stage 1 and Stage 2 complaints responded to within target timeframes (varies by nation).

- Average time in working days to respond to Stage 1 and Stage 2 complaints.

How have reported complaints resulted in change of practice within the housing provider?

The arrangements set out in C23 help us capture customer dissatisfaction consistently and use it to improve services.

Complaint volumes increased in 2024/25 following changes to the Housing Ombudsman Complaint Handling Code. In 2025/26, volumes reduced to 2,523, a 3.92% reduction on the previous year, showing early signs of stabilisation alongside improvements in service delivery.

Performance has remained strong:

  • 99.2% of Stage 1 complaints responded to within timescale (TSM CHO2)
  • 97.0% of Stage 2 complaints responded to within timescale (TSM CHO2)

Most complaints are resolved without escalation:

  • 84.3% resolved at Stage 1
  • 17.7% escalate to Stage 2, below sector benchmarks

Customer satisfaction with complaint handling also improved, rising from 43.2% to 54.6%.

The type of complaints we receive is also changing. Complaints about repair timescales have reduced, reflecting the improvements we have made in that service area.


How complaints have resulted in change of practice

We use complaints as a direct source of insight into where services are not meeting expectations and where we need to make practical changes.

Through regular reporting to senior management, resident committees and governance, and detailed review of individual complaints and emerging themes, we capture learning. This has led to changes in repairs and communication around them including:

  • follow-on repair appointments are now booked before leaving the property, so customers know immediately when work will be completed
  • customers have greater control over appointment scheduling, including booking and rescheduling
  • communication has been strengthened, including proactive follow-up after certain repairs such as damp and mould
  • van stock processes have been improved to increase first-time fix rates and reduce delays.

These changes are already contributing to fewer complaints, better satisfaction with complaint handling and fewer delays in key services. As a result, we’ve seen:

  • a reduction in overall complaint volumes
  • improved satisfaction with complaint handling
  • fewer delays and repeat visits in key services.

Our complaints process is supported by clear roles and responsibilities, so complaints are investigated, responded to and tracked through to completion.

Housing providers hold vast amounts of sensitive public data. That data needs to work safely, responsibly and intelligently to help us provide excellent customer service.

Our ‘Getting to Know You’ (GTKY) programme - designed to capture more customer data - alongside the introduction of 360 View - designed to improve how we use that data - represents a bold move in Karbon’s approach to data.

These two projects show how a large, public‑facing organisation can turn complex information into meaningful insight that improves outcomes for customers.

Historically, customer information within housing associations - Karbon included - was fragmented across multiple systems. Colleagues often had to navigate several screens to build a picture of a household, increasing the risk of missed information, inconsistent responses and reactive service delivery. This was particularly challenging when supporting customers with vulnerabilities or additional needs.

Karbon’s C2 grading also highlighted the need to strengthen customer insight and data consistency.

Through our Good to Great transformation programme, Karbon chose to address this challenge directly. As part of this work, we successfully contacted over 93% of customers, significantly exceeding the 90% engagement benchmark (set as part of our regulatory commitment).

We achieved this level of customer contact through a series of means which allowed customers to review and update their information through the MyKarbon self‑service portal, via secure smart links sent by email or text, or during face‑to‑face visits where colleagues used a new Power App to capture and update customer information in real time to input directly into our core systems.

Our renewed approach is not a temporary fix – it will enable us to sustain real‑time updates to the Housing CRM and create a more accurate understanding of each household.

The real transformation comes through 360 View. Embedded within our core IT systems, the 360 View application brings together data from across systems into a single, live customer view, giving colleagues immediate visibility of vulnerabilities, reasonable adjustments, active cases, recent repairs history and key contacts.

By combining high‑quality customer insight with live operational data, Karbon can identify emerging risks earlier, intervene sooner and target support where it will have the greatest impact.

Together, GTKY and 360 View show how as an organisation, we can use data responsibly to build safer, smarter and more anticipatory services for the communities we serve.

Please include support across any of the following areas, as well as any other relevant services:

- Employment & training

- Wellbeing & mental health

- Vulnerable tenants


Over the last year, we have supported customers in a range of ways, from help with finances and energy costs to employment, training, wellbeing and specialist housing support. These services work best when they are connected, helping us spot customers’ needs early and offer the right support at the right time.

We set up the Karbon Foundation in April 2026, which, going forward, will bring together our employment, skills and financial wellbeing support, our community investment programme, our place work and our befriending service into one offer for customers and anyone living in the communities we work in.


Employment and skills

Through our employability and support service, we supported 499 tenants to build skills, improve confidence and move closer to work, training or greater independence.

This support includes:

  • 162 tenants supported into training and qualifications
  • 126 tenants supported into employment outcomes
  • 108 tenants supported to improve digital skills.

These programmes provide practical routes into work, including our accredited training, our digital skills support and our tailored employment advice.

A recent example demonstrates how our services work together:

Lee’s path to employment with Karbon | Karbon Homes

In this example, a tenant first supported through our financial inclusion service was referred into our employability service. With tailored support, they went on to secure employment with Karbon.

This shows how our services can work together around a customer’s wider circumstances, supporting longer-term change rather than providing one-off help.


Customer finances and support for vulnerable tenants

GRAPH: Employee Net Promoter Score (eNPS) trend

Our financial wellbeing team helps customers maximise income, resolve benefit issues and manage financial hardship.

Over the last year, this support generated £8.3m total income gains for customers delivered through a combination of interventions including:

  • £838,600 in savings generated through the Northumbrian Water Support Plus Scheme, reducing household bills
  • 211 tenants supported through the Social Security Appeals process with a 78.2% success rate in appeals, helping resolve complex benefit issues and improve financial stability.

We also provided direct crisis support where customers needed urgent help:

  • 1,357 food crisis vouchers issued
  • £63,105 in food support provided
  • £31,286 in energy crisis vouchers distributed
  • 71 tenants supported through targeted support funds

This support helps customers deal with immediate pressures while also building longer-term financial stability.

Our current rent arrears stand at 2.3%, down from 2.65% last year and 3.42% the year before. This is the lowest level in five years and reflects the value of early, practical support. Lower arrears can also reduce wider pressures for customers, including issues linked to wellbeing, property condition and tenancy sustainability.

We introduced our ‘Something’s not Right’ (SNR) process in June 2024 to support customer-facing colleagues in identifying early signs of vulnerability during routine customer interactions.

The process enables colleagues to flag where ‘something isn’t quite right’, ensuring concerns are captured at the point of contact and directed to the appropriate specialist team. This provides a clear, operational mechanism for early intervention, embedded within day-to-day housing management.

The single digital referral form, accessible to colleagues during customer visits, covers a wide range of risks including safeguarding concerns, domestic abuse, anti-social behaviour, property condition, financial hardship and referrals into services such as financial wellbeing and employability support.

  • In 24/25 we had 58 SNR referrals submitted across housing and repairs teams (3 from housing; 55 from repairs)
  • In 25/26 we had 571 (88 from housing; 429 from repairs).

There will naturally be a correlation between the nature of SNR reports and the issues most prevalent in social housing. This year, we have therefore started to categorise the nature of each report, whilst we haven’t completed this task, the trends are as follows:

Description

Count

Property condition

104

Damp and mould

92

Adult concern

48

Financial wellbeing

49

Aids and adaptations

31

Animal concern

9

Child concern

8

Employment support

7

Customer engagement

6

Telecare and alarms

4

ASB (Anti-social behaviour)

3

(Unlisted miscellaneous)

2

Customer accounts

2

Domestic abuse

1

Resident events

1

Together with the Getting to Know You (GTKY) profiling approach mentioned earlier, (through which we capture and maintain up-to-date information on customers’ circumstances), these approaches ensure that both structured customer data and frontline observation are used to systematically identify and respond to need.

As a result, we strengthened our response to consumer standards, safeguarding duties and tenancy sustainment, helping respond to need as it arises, rather than relying solely on self-disclosure.

- Physical changes to shared spaces or public realm

- Events, activities, and signposting

Alongside supporting individual customers, we focus on the places people live in. Over the last year, we have worked with residents, partners and local organisations to bring space back into use, support local activity and rebuild confidence in neighbourhoods. By combining physical improvements with community programmes and local partnerships, we are helping create places that feel active, connected and sustainable over time.

Our approach brings together place-making and community investment, allowing us to align funding, partners and local priorities to build momentum and deliver visible change. This is particularly evident in places such as Byker and Stanley, where our long-term, coordinated investment and activity is helping strengthen both community infrastructure and local identity.

In Byker, our focus has been on creating lasting community assets. Working with partners, we secured over £107,000 from Historic England and more than £240,000 through the Heritage Lottery Fund to repurpose underused spaces into community and enterprise hubs. These spaces, previously vacant, are being transformed into flexible environments for skills development, local businesses and community activity - assets that local people can use and shape over time.

In Stanley, our work has centred on bringing visible life back to the high street. A programme of markets and events attracted over 1,900 visitors, with local traders, street food vendors and families returning to use the space in ways that had previously declined. Public realm improvements - including five large-scale shutter art installations - have transformed vacant units and contributed to a renewed sense of activity and confidence on the high street.

This has been complemented by cultural programmes that bring communities together across generations. Through initiatives such as Lumiere 2025 and Song for Stanley, residents of different ages have taken part in workshops and creative activity, working together to produce shared outputs that reflect local identity. These activities promote intergenerational engagement, strengthening connections between older and younger residents.

This work is reinforced through strong partnership structures. Two dedicated forums – the Stanley Stakeholder Reference Group and the Front Street Partnership - bring together over 140 stakeholders from more than 50 organisations, helping to align our activity and take a more coordinated approach to regeneration. Through this, we have supported the unlocking of over £300,000 of private investment into the town centre, demonstrating how partnership working can amplify impact beyond direct investment alone.

Alongside physical improvements, we have continued to invest directly in people and community organisations. Over the year, we provided £277,838 in funding across 187 grants, alongside a £16,000 Winter Fund supporting local projects delivering essential food and household support. This investment helps communities respond to immediate challenges while strengthening the organisations that underpin longer-term resilience.

Accessible local support has also been expanded through partnerships with organisations such as The Bread and Butter Thing, which provides affordable weekly groceries while acting as a trusted local community hub. Across our communities, these hubs have delivered over 450,000 meals, supporting more than 1,500 members. Beyond food provision, they have become informal entry points into wider support, helping residents connect with services and with each other in a familiar, accessible setting.

We have also continued to address social isolation, particularly among older residents. Through our Staying Connected service, previously known as Silver Talk and Silver Friends, we support over 400 residents thanks to a network of more than 100 volunteers, offering regular contact and opportunities for participation in community life.

Overall, the cash inflows (grants and social value) and outflows (Community Investment and Place funding) bring together a coordinated approach that is generating over £6.5m of combined value. Importantly, it complements our customer support services, ensuring that both individual resilience and community strength are developed together, with change that is visible, sustained and locally rooted.

What measures are in place to monitor the delivery of this social value?

Social value is one of the ways we use our spending power to create wider benefits for the places we work in. We build social value into procurement from the start with a 10% weighting applied to social value in all tenders over £100k. Over the last year, the value delivered through our contracts and partnerships has grown significantly:

  • £5.7m delivered in 2025/26, up from £2.4m - a 140% year-on-year increase
  • £5.4m delivered through the National Themes, Outcomes and Measures (TOMs) social value framework, up 128%. Reinforcing TOMs as the primary mechanism which quantifies and channels social value gives us a clear and consistent way to turn supplier commitments into practical outcomes.


Our progress in numbers

The timeline below shows how the changes we’ve made have led to social value growth:


The story behind the success: Creating value

The increase in the level of social value we generate is not just achieved through more procurement activity. It reflects a more hands-on approach to helping suppliers understand what local communities need and how their commitments can make a real difference.

We work closely with regional partners to ensure social value activity supports local priorities. Partnerships with the North East Mayoral Strategic Authority and the North East Institute of Technology help link supplier contributions to skills, employment and economic priorities across the region.

Support is then channelled through schools, colleges and our employment support service, helping turn commitments into opportunities that local people can access.

Across employability partnerships alone, suppliers delivered 2,674 hours of support, including mentoring, training and work-readiness activity.

Annual comparison
Measure 2025/26 2024/25 % Change
FTE Hired/Retained 168.44 87.5 +92%
Apprentice weeks 1,455 578.6 +151%
Weeks of paid placements 52 47 +10%
Hours of support into work assistance 2,674 536 +398%
Hours of school/college sessions 383.5 155 +147%
In kind and materials donations £65k £29k +124%
Volunteering hours 466 142 +228%
Resources for environmental conservation £0 £1,354 -100%
Expert business advice hours 34 11.5 +195%
Social value in £&p (TOMs) £5.7m £2.8m +103%
Social value (FTE value deducted) £1.1m £443k +150%
Number of contracts with social value delivery 50 47 +6%

The table shows strong growth across delivery measures, notably:

  • volunteering hours (+228%)
  • support into work hours (+398%)
  • apprenticeship weeks (+151%).

This growth has been driven by listening to partners, understanding where support is needed and matching supplier commitments to practical opportunities.

Our focus is on making sure social value does not stop at a promise in a contract. We work with suppliers and partners to turn those promises into measurable delivery.

For example, the 228% increase in volunteering hours was shaped by our work with food partnerships, where volunteer capacity was a clear and immediate need.

Wansbeck: At Wansbeck Valley Food Bank, partners needed drivers over the Christmas period. Suppliers responded directly, giving volunteer time where it was needed most.

Working closely with partners also helps identify smaller needs that can make a big difference. In one example, social value funding helped replace a broken label printer, removing a practical barrier for a local charity.

Across the programme, suppliers delivered 466 volunteer hours across 27 projects, alongside £65,000 of in-kind contributions supporting 45 projects.

Building Self Belief: Our work with Building Self Belief shows how social value can help community organisations build capacity and improve the spaces they use.

Building Self Belief is a longstanding community partner delivering youth and community activity. When the organisation had the opportunity to take on a 25-year lease for a local building, it needed practical support to make the space usable.

We helped bring partners and suppliers together to support the project:

  • Mitie provided materials and trade staff to decorate the building
  • CEF designed the lighting and donated materials
  • £4k from the social value fund was used to unlock £10k from Durham County Council for new windows

Final insights

The results show that social value as a percentage of procured expenditure is increasing. This tells us that impact comes from how commitments are designed, supported and followed through, not just from how much we procure.

Overall, our approach works best when social value is rooted in local need, shaped by strong partnerships and actively managed through to delivery.


Governance


This section explains how Karbon is governed, how we stay accountable and how we maintain strong control over our business while continuing to deliver for customers and communities.

Over the past year, our approach has been tested through regulatory inspection. We retained the highest possible ratings for governance and viability, with G1 and V1 gradings, alongside a C2 rating under the Consumer Standards. The Regulator recognised strengths in customer and building safety, asset data, customer engagement and complaints handling.

The inspection also highlighted areas where we need to improve, particularly non-urgent repairs and our understanding of customers’ diverse needs. We are responding through targeted investment, including extra repairs capacity and the continued development of Getting to Know You as a rolling programme of gathering customer insight.

Our focus is on maintaining strong governance while responding to rising expectations around customer outcomes, service performance and regulatory compliance. These areas are closely connected: the quality of our homes, the reliability of our services, our financial resilience and the trust customers place in us all depend on good governance.

The first part of this section, C28 to C38, sets out how governance, risk and accountability are managed. The second part, C39 to C44, focuses on our people, because strong governance also depends on skilled, supported and engaged colleagues.
Structure and board


UN sustainable development goals: 8 - decent work and economic growth and 16 - peace, justice and strong institutions

In September 2025, Karbon was awarded the following regulatory status:

Governance G1 / Viability V1 / Consumer C2

Are ESG risks incorporated in the housing provider’s risk register?

Yes. ESG risks are incorporated within Karbon's strategic risk framework and principal risk register. Rather than being managed as a single standalone risk, ESG considerations are embedded across a number of our principal risks, particularly investment in existing homes, customer service and satisfaction, governance and compliance, and people.

The Board sets the organisation's risk appetite annually and receives quarterly reporting on principal risks, performance and assurance. Committees are responsible for monitoring risks within their delegated authority, while the Group Audit and Risk Committee oversees the overall effectiveness of risk management and internal control arrangements.

Environmental risks are primarily overseen through the Group Development Committee, including net zero delivery, environmental sustainability and asset compliance. Social risks, including customer service, customer outcomes and consumer regulation, are scrutinised through the Group Customer Committee. Governance, compliance, health and safety, data quality and workforce capability are overseen through the relevant Board committees. 

Strategic risks are reviewed quarterly by the Group Executive Team and supported by regular horizon scanning to identify emerging legislative, regulatory and sector risks. The Board receives assurance through performance reporting, compliance monitoring, internal audit and independent scrutiny, supported by the Group's Three Lines assurance framework. 

ESG risks are also integrated into long-term business planning. Key areas such as decarbonisation, asset investment, consumer regulation and workforce capability are reflected within our 30-year business plan and are regularly stress-tested to ensure delivery remains affordable, sustainable and aligned to our strategic objectives.

There have been no adverse regulatory findings resulting in enforcement or equivalent action during the last 12 months.

We use customer insight, resident involvement and board review to make sure a broad range of voices inform governance.

We know that governance cannot rely only on the people who choose to take part in formal engagement. Some customers may be less visible or may not feel able to share their views directly. Our approach brings together active customer voice with wider insight so decisions are informed by a fuller picture of the communities we serve.

Getting to Know You is central to this, providing a continuously updated baseline of customer data (and need) through digital contact and customer interactions. Using data alongside customer voice gives us a more current and representative understanding of customers’ needs, rather than relying on one-off surveys or self-selected feedback.

We also provide a range of ways for residents to influence services and decision-making:


Scrutiny and accountability

  • Scrutiny Bank – undertakes service reviews and reports findings into governance
  • Complaints Review Panel – reviews complaint handling and strengthens customer challenge
  • Customer Readers Panel – scrutinises how policies and services are communicated


Service design and decision-making

  • Procurement Panel – involved in contractor selection, evaluation and monitoring
  • Building Safety Panel – shapes safety communication and engagement
  • Customer Environment Group – influences environmental strategy and delivery
  • Grants Panel – shapes community investment decisions


Community voice and lived experience

  • Sheltered Housing Residents Forums – represent older residents and supported housing
  • Leaseholder Group – reflects leaseholder perspectives
  • Young person engagement – captures the voice of younger customers
  • Area-based and thematic groups – reflect place-specific and emerging issues


These groups focus on practical issues and service outcomes, helping make sure customer input is grounded in lived experience.

Insight from this work is brought together through the Karbon Residents Committee, creating a clear route into formal governance and board-level discussion. The Chair and Vice Chair of the Karbon Residents Committee also sit on our Group Customer Committee alongside board members.

GRAPHIC: Formal governance and customer voice

We also regularly review the skills, experience and diversity of the board and its committees, using this to inform future recruitment and succession planning.

Our framework helps governance reflect both the voices we hear directly and the needs that may otherwise be less visible.

We build equality, diversity and inclusion into board and senior recruitment through succession planning, targeted recruitment and pipeline development.

Our Board Succession Policy requires an annual review of our board and committee composition, looking at skills, experience and diversity. Any gaps we identify through this review help shape future recruitment.

Our Group People Committee oversees appointments, helping ensure a transparent process that considers both individual capability and overall board balance.

We widen the candidate pool by:

  • partnering with the Housing Diversity Network 
  • open recruitment combined with targeted outreach 
  • encouragement of applications from individuals with lived experience of social housing. 

We also support a Board Trainee Programme, providing a structured two-year route into governance. This helps build confidence, experience and a more diverse pipeline of future board and committee members.

This makes our approach deliberate and forward-looking, strengthening representation over time rather than relying on individual appointments alone.

Board turnover over the last two years was 41.67%.

Five of the 12 Board members changed during this period: one resignation and four members reaching the end of their tenure.

Three members of the Audit Committee have recent and relevant financial experience.

91.7% of board members are non-executive directors (11 of 12 board members).

The current external audit firm partner has been responsible for auditing the accounts for eight years. The contract was retendered and reappointed in 2025/26.

The last independently run board effectiveness review took place in December 2023. The next review is planned for Q3 2026/27.

Board members declare interests when they are appointed, annually and within 28 days of any new conflict arising. These interests are recorded in a central, publicly available register overseen by the Company Secretary. At meetings, conflicts are declared and managed by the Chair. Where needed, members withdraw from discussions or decisions. If a conflict cannot be managed appropriately, the member may be required to step down.

Employees


UN sustainable development goals: 8 - decent work and economic growth and 12 - responsible consumption and production

Yes.


Mean  

Median 

2022/23 

4.9% 

1.1% 

2023/24 

4.7% 

1.1% 

2024/25 

5.5%

 0.9%

2025/26

3.7%

-0.6%

The following figures are calculated using a standardised methodology set by the Department of Business, Energy and Industrial Strategy (BEIS) in 2019 known as Option A. This method represents the most statistically accurate way of identifying UK employee remuneration using three percentile points for added clarity.

Year

25th percentile pay ratio

50th median percentile pay ratio

75th percentile pay ratio

2025-2026

8.00:1

6.38:1

5.81:1

We promote equality, diversity and inclusion (EDI) across our workforce through a combination of clear policy, embedded processes and active colleague-led initiatives, supported by external validation. 

Our approach is underpinned by the Inclusion and Belonging Policy, which sets out our commitment to eliminate discrimination, promote equality of opportunity and create an inclusive working environment for colleagues at all levels.  

This is reinforced by the Dignity and Respect at Work Policy, which establishes clear expectations of behaviour and provides a framework for preventing and addressing bullying, discrimination and harassment. It applies to all colleagues and ensures concerns can be raised and addressed in a fair and consistent way.  

All policies, strategies and major decisions are subject to an Equality Impact Assessment (EQIA), which assesses impacts on colleagues with protected characteristics and wider vulnerabilities before implementation. This ensures barriers are identified early, mitigated and monitored, embedding EDI into decision-making rather than applying it retrospectively.  

We also promote EDI through practical, colleague-led initiatives. Our Inclusion Hubs provide structured spaces for colleagues to share experiences, influence policy and drive change. For example: 

  • The Pride Hub supports LGBTQ+ colleagues and allies, raising awareness and building understanding 
  • The DANI Hub (Disability and Neurodiversity Inclusion) brings together colleagues to identify and remove barriers in the workplace  

These hubs are colleague-led and feed directly into organisational priorities and action planning. 

We measure and improve our approach through external benchmarking and feedback. We work with the National Centre for Diversity (NCFD), using colleague surveys to understand lived experience and inform our action plan.

This has contributed to our achievement of Silver Investors in Diversity accreditation, recognising progress in embedding fair and inclusive practices across the organisation.  

Our approach has also been externally recognised through excellence awards in diversity and inclusion, demonstrating the impact of our policies, colleague engagement and our continuous improvement approach. 

Together, this ensures that EDI is defined in policy, embedded through process, shaped by colleagues and tested through independent assessment, creating a working environment where colleagues feel supported, included and able to thrive. 

We take a structured and practical approach to supporting our colleagues’ health, combining accessible healthcare, flexible working conditions and a culture that encourages openness and early support.


Health and wellbeing activity

Our approach is structured around five priorities: Be healthy, Be safe, Be resilient, Be connected and Be savvy, covering physical health, mental health, safety, social connection and financial wellbeing.

Colleagues access support through a central Wellbeing Hub, providing a clear route into services such as 24/7 counselling, condition-specific guidance and direct support.

Alongside this, peer support is available through dedicated Teams channels, where colleagues can speak openly about shared experiences. These include channels focused on neurodiversity , cancer support, menopause and mental health.

They are active, colleague-led spaces rather than static resources, helping to create a culture where conversations about health are normalised and support is visible.

Our approach has been externally recognised through Better Health at Work Ambassador status, awarded through the regional Better Health at Work programme, which recognises employers who demonstrate long-term, embedded commitment to workplace health. Achieving Ambassador status reflects sustained delivery over time, leadership involvement and continuous improvement, rather than one-off initiatives.


Tangible support for physical and mental health

Colleagues have direct access to healthcare through our Health Cash Plan (BHSF). We fund the full cost of the bronze level as a core benefit, meaning colleagues can claim money back on everyday healthcare costs such as dental treatment, eye care and physiotherapy, without needing to opt in or pay additional premiums.

The plan also includes 24/7 GP access and counselling support. Where counselling is needed, colleagues are matched with a specialist and offered a structured programme of support (minimum six sessions per issue), providing continuity rather than one-off conversations.

Additional tools support day-to-day wellbeing, including the My Mind Pal app (mental health monitoring and prompts) and BHSF Connect, which brings guidance, services and support together in one place.

This is reinforced through a strong organisational culture. Mental Health Allies are trained to recognise early signs of stress and provide a safe, informal first point of contact, helping colleagues access support quickly and without stigma.

We recognise the impact of working conditions on health. Colleagues receive a £633.38 annual flexible benefits pot, which they can either take as additional pay or use to purchase benefits such as private medical insurance, health screening or additional leave. This flexibility allows individuals to tailor support to their own circumstances.

This sits alongside 26–31 days' annual leave (increasing with service) and enhanced parental support, enabling colleagues to balance work with health and life events.

Our Employee Net Promoter Score (eNPS) is generated via surveys which ask employees if they believe Karbon is ‘a great place to work’. Our rising scores show that our colleague perception of Karbon is outstanding:

Year

ENPS

2019/20

-9

2020/21

+29

2021/22

+27

2022/23

+23

2023/24

+39

2024/25

+43

2025/26

+42


HIVE - the organisation who designed the framework - produced the following guidance which indicates that our eNPS score of +42 is ‘outstanding’:

  • +40 = outstanding
  • +20 to +40 = very good
  • -10 to +20 = average
  • -10 or less = below average

Alongside strong engagement, colleague wellbeing is reflected in stable levels of attendance across the organisation. During 2025/26, average sickness absence was 10.33 days per colleague. This figure is composed of short-term absences at 6.26 days per year plus longer-term absences which add a further 4.07 days. This indicates a stable and well-supported workforce, with no evidence of systemic pressure or imbalance.

With 1,336 colleagues, we continue to invest in professional development to build capability, support progression and improve service delivery.


Professional development activity

We invest in development through formal qualifications, leadership programmes and applied workplace learning.

Qualifications and CPD

  • 38 applications for qualifications in 2025/26, with 28 approved (74%)
  • £63,922 invested, more than doubling investment from the previous year

This increased investment reflects a more targeted approach, aligning development to organisational priorities and skills gaps.


Leadership development and pipeline

We are actively building leadership capability through structured programmes.

Aspire to Lead

Aspire to Lead is designed to develop future leaders through a blend of exposure, mentoring and practical experience, helping colleagues build confidence and transition into leadership roles.

  • 57 colleagues developed since launch (2024)
  • 56% of those who complete the programme have enjoyed career progression
  • Programme NPS +92, our highest performing development offer


Leadership Essentials

  • 52 colleagues developed this year across four sessions
  • 38 new managers enrolled
  • Programme NPS +70, with participants reporting strong confidence in applying learning

Participants completing the full programme report an NPS of +100, with clear feedback that it equips them to lead effectively.


Onboarding and early development

Our onboarding approach is a key part of early development and engagement:

  • Our welcome programme has an NPS of +68, with 93% of colleagues saying it was worth their time
  • New starters report 100% confidence in being prepared for their role and 90% would recommend Karbon as a place to work

This translates into engagement outcomes:

  • NPS +61 for colleagues with less than one year’s service

This upward movement shows that early investment in development is strengthening engagement from the outset.


Ongoing learning and development

  • Colleagues completed 12,113 hours of learning (8.5 hours per person)
  • 88.7% compliance across mandatory training

This is supported by our ‘3Es model’ (Experience, Exposure, Education), ensuring learning is embedded in day-to-day roles.


Impact on staff and organisation

The impact of this investment is reflected in sustained improvements in engagement and leadership capability.


Colleague engagement (Hive)

Our Employee Net Promoter Score (eNPS) has improved from -9 (2019/20) to +42 (2025/26), representing a sustained shift to high engagement and advocacy.

Hive surveys also provide real-time insight into leadership effectiveness. Scores such as ‘My Manager’ - 8.55 out of 10 - reflect consistently strong performance, with feedback used regularly to inform development priorities and leadership support.


Organisational impact

This investment is translating into:

  • stronger leadership pipeline, with clear progression from Aspire to Lead
  • high engagement among new starters, supporting retention and culture
  • more confident, capable managers, improving decision-making and team performance
  • a resilient workforce, better equipped to respond to customers’ needs.


Professional standards

Our approach aligns with the Conduct and Competency Standard, with the Conduct and Competency Policy (2025) embedding the skills, knowledge and expected behaviours across recruitment, development and performance management. The ongoing qualification programme provides a structured pathway for colleagues to achieve and maintain the professional standards expected within the social housing sector. We have identified 118 colleagues, across 74 roles, who will be required to have a qualification.

Of those 118, 25% already have a suitable qualification, 17% need a top-up to bring their qualification in line with the regulations, 5% are currently undertaking a qualification and the remainder will need to complete theirs by October 2029.

The aim of the ESG report is to provide transparency and insight into the challenges we face but also to highlight the opportunities coming our way. For example, the ways in which we apply big spending programmes like domestic retrofit give us unprecedented economic leverage. In tandem, regional devolution has given us the political forum to do things better. We would therefore appeal to a range of stakeholders from institutional investors, local authorities, charities, public and charitable funders to read our report and we invite you to join us in tackling challenges like cost of living, and opportunities like employment and skills and net zero.   

For investor queries please contact james.clifford@karbonhomes.co.uk. For customer queries please contact info@karbonhomes.co.uk.  

Recite Me